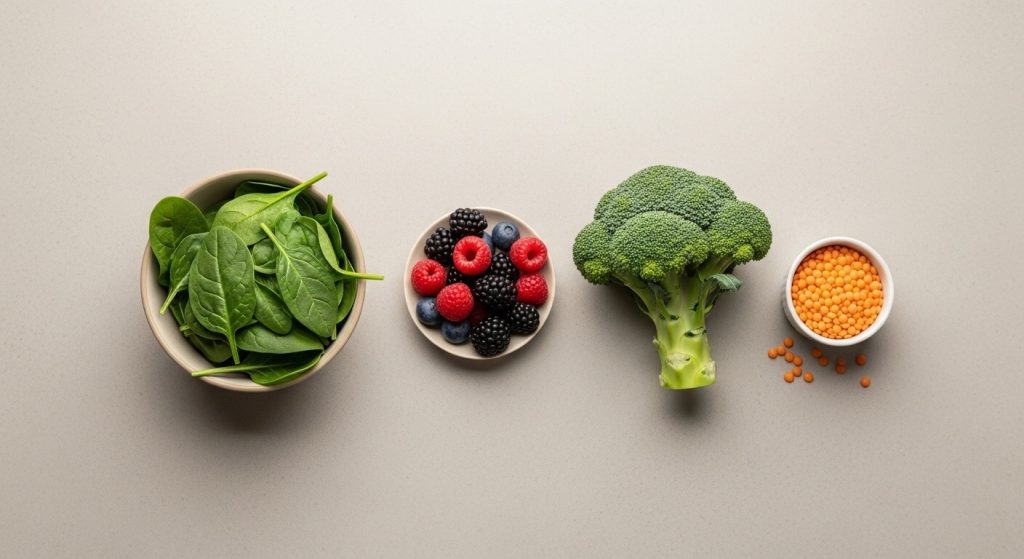
“Nutrient-dense” is the phrase every piece of official US nutrition advice now leans on. The Dietary Guidelines for Americans, 2025–2030 tells households to build diets on “whole, nutrient-dense foods—protein, dairy, vegetables, fruits, healthy fats, and whole grains.”
Here is the awkward part, and we would rather you heard it from us: the current Dietary Guidelines use the phrase seven times and never define it. There is no glossary entry, no formula, no calories-per-nutrient threshold. Neither the FDA nor the USDA operates or endorses a nutrient-density score.
So what follows is not another scoring system. It is what the official sources do define — and how to use those definitions to make the choice the phrase is gesturing at.
What official sources actually give you
Three things are genuinely defined in US regulation, and together they do the job.
1. The %DV rule of thumb
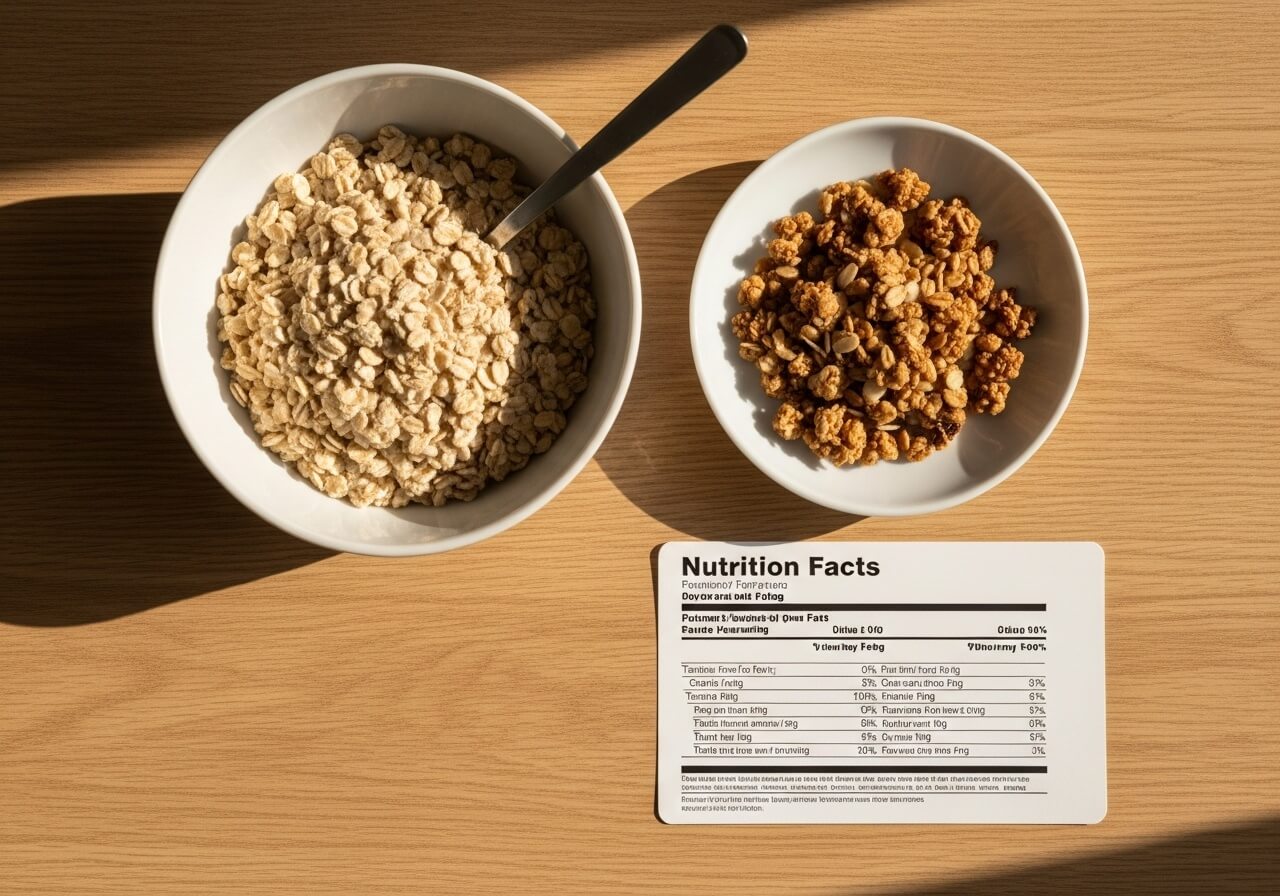
FDA’s guidance for reading a Nutrition Facts panel is deliberately simple: “5% DV or less of a nutrient per serving is considered low” and “20% DV or more of a nutrient per serving is considered high.” Daily Values are set against “a 2,000-calorie daily diet.”
This is the closest thing to a nutrient-density instrument that a shopper actually has, and it is on every package. We cover reading the panel end to end in how to read nutrition labels and the %DV column specifically in what percent Daily Value really means.
2. The legal thresholds behind “high” and “good source”
These are not marketing language — they are codified in 21 CFR 101.54. A food may be called high in a nutrient only at “20 percent or more of the RDI or the DRV per reference amount customarily consumed,” and a good source at “10 to 19 percent.”
Worth noting what is absent from that regulation: the words “superfood” and “nutrient dense” do not appear in it at all. More on that below, and in what food label claims are allowed to say.
3. FDA’s “healthy” criteria
In the absence of a federal nutrient-density definition, this is the nearest operational stand-in. FDA finalised an updated “healthy” claim on 19 December 2024. To carry it, a food must “contain a certain amount of food from at least one of the food groups or subgroups (such as fruit, vegetables, grains, fat-free and low-fat dairy and protein foods)” and “meet specific limits for added sugars, saturated fat and sodium.”
The structure is the useful part: a minimum of something good, plus caps on three specific things. For a vegetable product, that means at least a ½-cup equivalent of vegetables, with added sugars at or under 1 g, sodium at or under 230 mg, and saturated fat at or under 1 g per reference amount.
FDA also states that single-ingredient whole foods qualify automatically — “single-ingredient nutrient-dense foods without added ingredients besides water.” A plain apple needs no calculation.
A working definition, then. A nutrient-dense food supplies a meaningful amount of at least one food group and stays under the added sugar, saturated fat and sodium caps. That is FDA’s structure, not ours — and it is far more usable than any score, because you can check it on a label.
The three limits worth knowing by heart
Straight from the 2025–2030 edition:
| What | Current guidance |
|---|---|
| Added sugars | “one meal should contain no more than 10 grams of added sugars” |
| Saturated fat | “saturated fat consumption should not exceed 10% of total daily calories” |
| Sodium | “the general population, ages 14 and above, should consume less than 2,300 mg per day” |
Note the added-sugars figure carefully: the current edition frames it per meal, in grams. If you have seen “under 10% of daily calories” quoted, that is the previous edition’s wording and is no longer what the guidelines say. Ten grams is about two and a half teaspoons — less than most flavored yogurts and well under a single sweetened coffee drink. Where added sugars hide is its own subject, covered in hidden sugars in healthy foods.
The current edition also drops the old “empty calories” framing entirely. Its section heading now reads “Limit Highly Processed Foods, Added Sugars, & Refined Carbohydrates,” with the instruction to “prioritize nutrient-dense foods and home-prepared meals.”
The nutrients Americans actually fall short on
A caveat first, because it matters: the familiar list of “nutrients of public health concern” does not appear in the 2025–2030 Dietary Guidelines. That phrasing came from an earlier edition. So we source each nutrient individually to NIH’s Office of Dietary Supplements, which reports intake data directly.
| Nutrient | What the data show | Foods with real amounts |
|---|---|---|
| Calcium | “49% of children age 4 to 18 years and 39% of all individuals age 4 and older consume less than the EAR” | Low-fat yogurt (8 oz) 415 mg; canned sardines with bones (3 oz) 325 mg; nonfat milk (1 cup) 299 mg; cooked kale (1 cup) 94 mg |
| Vitamin D | “92% of men, more than 97% of women” ingest less than the EAR from food and beverages | Cooked sockeye salmon (3 oz) 14.2 mcg / 570 IU; fortified 2% milk (1 cup) 2.9 mcg / 120 IU |
| Potassium | “Dietary surveys consistently show that people in the United States consume less potassium than recommended” | Large baked russet potato 1,644 mg; 1 cup raw black beans 2,877 mg; 1 plantain 1,315 mg |
| Fiber | Mean intake “was 16 grams per day” (USDA survey, 2009–2010 data) | Chia seeds 34.4 g per 100 g; flaxseed 27.3 g; raw kidney beans 24.9 g; raw lentils 10.7 g |
Look at what that table is telling you. The shortfalls cluster around dairy, oily fish, legumes, potatoes and seeds — not around anything exotic or expensive. If you are choosing foods for nutrient density, these four nutrients are where the actual gap is, and the fixes are ordinary groceries.
Fiber in particular is worth a closer look, since 16 g against an Adequate Intake in the high 20s to 30s is a large shortfall. We break it down in fiber content in foods and high-fiber foods.
Calorie density is a separate lever — and a useful one
Nutrient density asks what a food gives you. Calorie density asks how much room it takes up. CDC’s guidance defines it as “the number of calories in a particular amount or weight of food” and explains the mechanism: “foods that have a lot of water or fiber and little fat are usually low in calorie density. They will help you feel full without an unnecessary amount of calories.”
The behavioural finding underneath it is the interesting bit: “research shows that people get full by the amount of food they eat, not the number of calories they take in.”
CDC’s worked example: a macaroni and cheese recipe rebuilt with non-fat milk, less butter and added vegetables goes from “about 540 calories in one serving (1 cup)” to “315 calories in one serving (1 cup).” Same bowl, same fullness, 225 fewer calories.
Foods CDC puts in the “choose more often” column: “fruits and vegetables (prepared without added fat)…low-fat and fat-free milk products…broth-based soup…whole grains…legumes (beans and peas)…lean meat, poultry and fish.” In the “less often” column: “fried foods…fatty cuts of meat…full-fat milk products…dry snack foods…higher-fat and higher-sugar foods.”
These two levers can point opposite ways. Nuts, olive oil and oily fish are calorie-dense and nutrient-dense. Lettuce is calorie-light and not carrying much. Neither metric alone tells you what to eat — which is exactly why no single score works.
About the scores you have seen
Several nutrient-density scoring systems circulate as if they were official. None is.
The National Academies looked at front-of-package rating systems and found that “among the existing FOP nutrition rating systems and symbols, no two have been developed for exactly the same purposes; similarly, no two have the same underlying nutrient criteria.” They noted that some algorithms “are not publicly available,” and that “a lack of transparency makes it impossible to have independent assessment of the scientific basis underlying the algorithm.” They also flagged a specific loophole: “fortification may be likely to improve the rating of a product that contains nutrients of concern.” A fortified cereal can out-score a food with nothing added to it.
| System | What it actually is |
|---|---|
| NRF9.3 (Nutrient Rich Foods Index) | Peer-reviewed academic tool, not a government standard. Validated against the Healthy Eating Index — another index, not health outcomes. Its own paper reports that “index performance actually declined with the inclusion of additional vitamins and minerals.” |
| Nutri-Score | A voluntary European front-of-pack label used in seven countries, on an A–E color scale. No US regulatory role and not on US labels. |
| ANDI | A proprietary system created by one physician and sold alongside his branded products. Its 1,000 ceiling was assigned by definition: “the raw point totals were converted…so that the highest ranking foods (leafy green vegetables) received a score of 1000.” “Kale scores 1000” is circular, not a finding. |
The consequence is that “the most nutrient-dense food” changes depending on which unofficial system you consult. Watercress, kale, liver and sardines all get crowned somewhere. None of those crownings has federal backing.
What is coming: front-of-package labels
In January 2025 FDA proposed requiring a front-of-package “Nutrition Info” box on most packaged foods, showing “whether the food has ‘Low,’ ‘Med’ or ‘High’ levels” of saturated fat, sodium and added sugars. The comment period was extended “until July 15, 2025.”
This is a proposed rule, not a final one, and calories are not in the proposed box. If it is finalised, larger businesses would have three years to comply and smaller ones four. Until then, the %DV column on the back of the pack remains the tool you have.
How to actually shop this way
No score required. Five habits, each traceable to a source above:
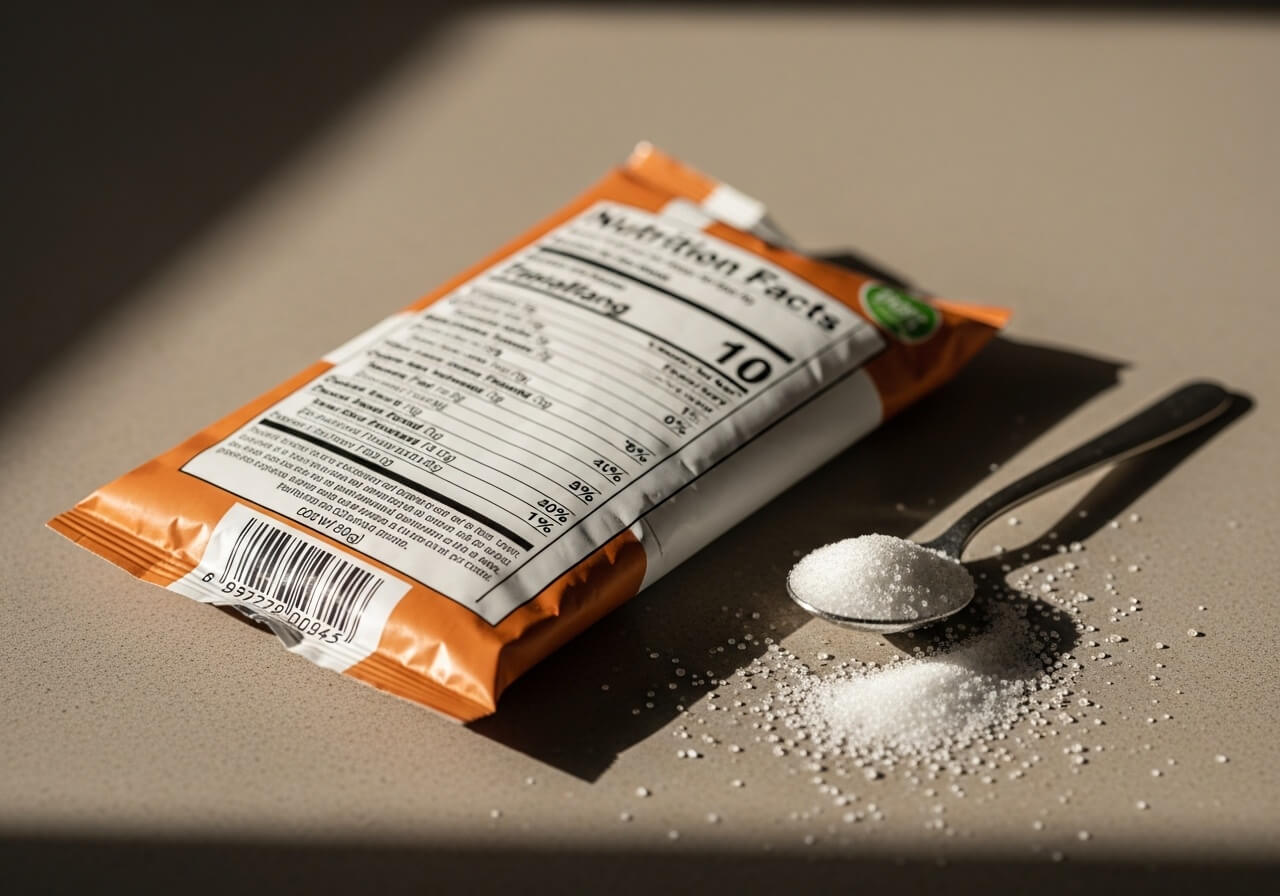
- Use the 5/20 rule. Under 5% DV is low, 20% DV or more is high. Check the nutrients you are short on, not every line.
- Check the three caps. Added sugars, saturated fat, sodium — these are what FDA’s “healthy” criteria limit and what the Dietary Guidelines put numbers on.
- Aim at the real gaps. Calcium, vitamin D, potassium and fiber are where US intake data show shortfalls. Dairy, oily fish, legumes, potatoes and seeds cover all four.
- Buy food that needs no label. FDA exempts single-ingredient whole foods from its criteria for a reason.
- Use calorie density where volume matters. Water- and fiber-rich foods fill the plate for fewer calories, per CDC.
Everything else — the scores, the rankings, the word “superfood” — is decoration on top of those five.
FAQ
What does “nutrient-dense” officially mean?
There is no official definition. The 2025–2030 Dietary Guidelines use the term repeatedly without defining it, and no US agency operates a nutrient-density score. The nearest operational standard is FDA’s “healthy” claim: a minimum amount from a food group, plus limits on added sugars, saturated fat and sodium.
Is there a nutrient density score I can trust?
Not an official one. The National Academies found that no two rating systems use the same criteria, that some algorithms are not public, and that fortification can inflate a product’s rating. Treat any score as one company’s opinion.
Is “superfood” a real classification?
No. The word does not appear in 21 CFR 101.54, the regulation that defines nutrient content claims, and no federal agency defines it. It has no legal standing in US food labeling.
What is the difference between nutrient density and calorie density?
Nutrient density is about what a food supplies; calorie density is about how many calories are packed into a given weight. They often move together but not always — nuts and oily fish are dense in both, which is not a contradiction.
How much added sugar is too much?
The current Dietary Guidelines state that one meal should contain no more than 10 grams of added sugars. That is roughly two and a half teaspoons.
Which nutrients do Americans most often fall short on?
Based on federal intake data: calcium (39% of people over 4 fall below the estimated average requirement), vitamin D (over 92% from food alone), potassium, and fiber, where mean intake was measured at 16 g a day.
Should I eat the rainbow?
Variety is genuinely advised — the Dietary Guidelines say to “eat a variety of colorful, nutrient-dense vegetables and fruits.” But no official source maps colors to specific nutrient classes or sets a number of colors per day. Color is a memory aid for variety, not a nutritional metric.
This content is for educational purposes only and is not medical advice. Always consult a qualified healthcare professional for personalised guidance.