The label target is 28 grams a day and the average American gets about 58% of what is recommended. The tables below give the fiber content of real foods from our own database, each value traced to a named USDA record — and they are split by whether the food is weighed dry or ready to eat, because that single distinction is where most fiber lists mislead people. Our fiber intake calculator turns that into a target for your own age and sex.
The short version
- Daily Value on the Nutrition Facts label: 28 g. MedlinePlus gives adults 21–38 g; NIDDK 22–34 g.
- Actual intake: 8.1 g per 1,000 calories against a recommended 14 — 58% of target.
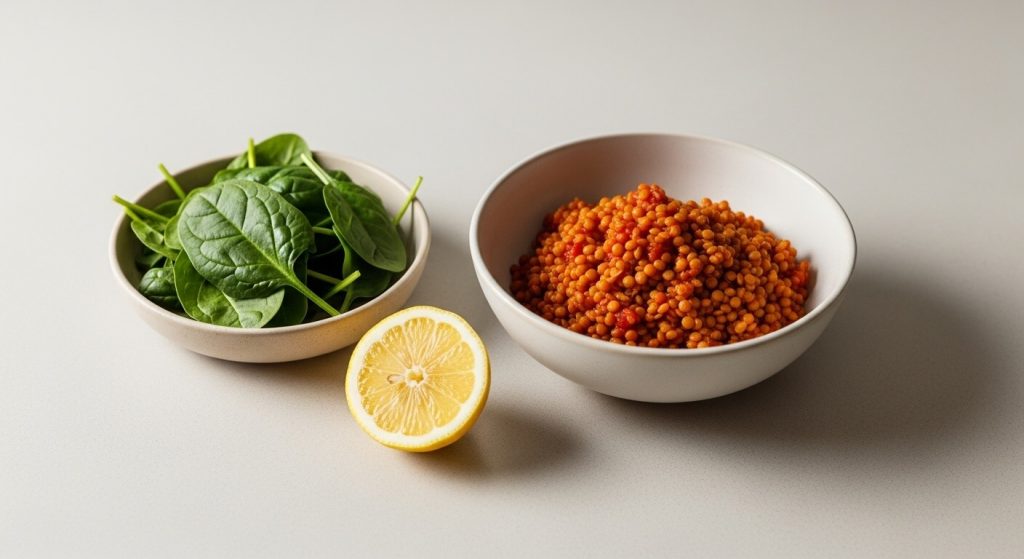
- Dry lentils show 10.7 g per 100 g. A cooked portion is nothing like 100 g of dry lentils. Watch the state of the food.
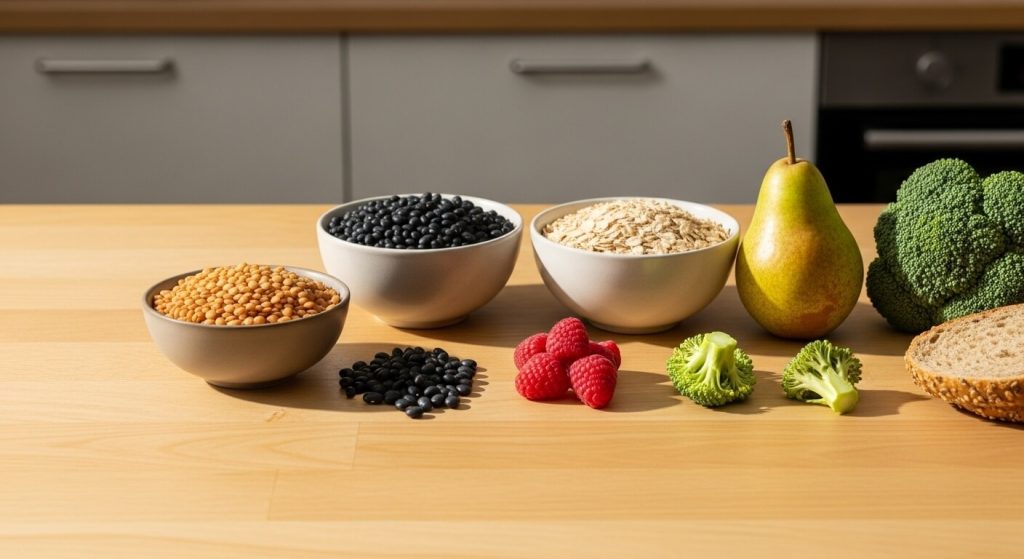
- Highest per 100 g: chia seeds, flaxseed, bran and dry legumes. Highest per realistic portion: beans, oats, berries.
- Raw potato shows a very high fiber figure for a methodological reason, not a nutritional one. Explained below.
How much you need
FDA uses 28 g per day as the Daily Value on the Nutrition Facts label, and states that most Americans do not get the recommended amount of dietary fiber. MedlinePlus puts the adult range at 21 to 38 grams of fiber each day against a US average of about 16 grams daily. NIDDK gives 22 to 34 grams a day depending on your age and sex.
USDA’s Economic Research Service measures the gap in density rather than grams: 8.1 grams of fiber for each 1,000 calories in 2017–18, or 58 percent of the recommended 14 grams per 1,000 calories. That framing is useful — it says the problem is what the calories are made of, not only how many there are.
The trap in every fiber list: dry versus ready to eat
Nutrient databases report per 100 grams of the food as described. For dry lentils, oats or flour, that is 100 g of dry product — several times what ends up on a plate after it absorbs water. Lists that mix dry staples with raw vegetables in one ranking make beans and grains look unbeatable and vegetables look pointless, when the real difference is largely water. Two label-to-label comparisons built on the same database: corn and flour tortillas and whole wheat and white bread.
So the tables below are separated. Every food links to its card, where the value and its USDA source record are shown together.
Weighed dry (per 100 g of the dry product)
| Food | Fiber, g | Calories |
|---|---|---|
| Sorghum bran | 34.9 | 403 |
| Chia seeds | 34.4 | 517 |
| Coconut flour | 34.2 | 438 |
| Soy flour, defatted | 24.3 | 366 |
| Flaxseed | 23.1 | 545 |
| Cannellini beans, dry | 15.2 | 345 |
| Rye flour | 13.7 | 359 |
| Barley flour | 12.8 | 367 |
| Chickpeas, dry | 12.2 | 383 |
| Oats | 12.0 | 381 |
| Bulgur, raw | 11.7 | 372 |
| Almonds, raw | 10.8 | 626 |
| Lentils, dry | 10.7 | 360 |
| Whole wheat flour | 10.6 | 370 |
| Blackeye peas, dry | 10.6 | 354 |
| Rolled oats | 10.4 | 382 |
| Sunflower seed kernels | 10.3 | 612 |
Ready to eat (per 100 g as eaten)
| Food | Fiber, g | Calories |
|---|---|---|
| Figs | 9.8 | 249 |
| Hass avocado | 6.8 | 223 |
| Raspberries | 6.5 | 57 |
| Prunes | 6.3 | 240 |
| Corn tortilla | 6.3 | 218 |
| Peas, canned | 6.0 | 80 |
| Chickpeas, canned | 5.9 | 137 |
| Blackberries | 5.3 | 43 |
| Brussels sprouts | 4.8 | 59 |
| Sweet potatoes | 4.4 | 79 |
| Kale, raw | 4.1 | 35 |
| Collards | 3.8 | 47 |
| Beets | 3.1 | 45 |
| Carrots | 3.1 | 48 |
| Pears | 3.1 | 57 |
| Kiwifruit | 3.0 | 58 |
Notice what the second table does to the calorie question. Raspberries deliver 6.5 g of fiber for 57 calories; canned chickpeas deliver 5.9 g for 137. Both are good answers; they are good answers to different problems.
Why potatoes are not in these tables
Our card for russet potato shows 14.9 g of fiber per 100 g, which would put it near the top of any ranking. The number is transcribed correctly from its USDA record — but that record measures the raw potato using AOAC 2011.25, a method that counts resistant starch as dietary fiber. Raw potato starch is largely resistant, so the method returns a figure that is technically valid and practically misleading, since nobody eats raw potato.
We left the value on the card, added a note explaining the method, and kept potatoes out of the tables above. Any fiber list that ranks potatoes above beans has run into the same measurement without noticing it.
What 28 grams looks like in a day
Working from the tables, without anything unusual:
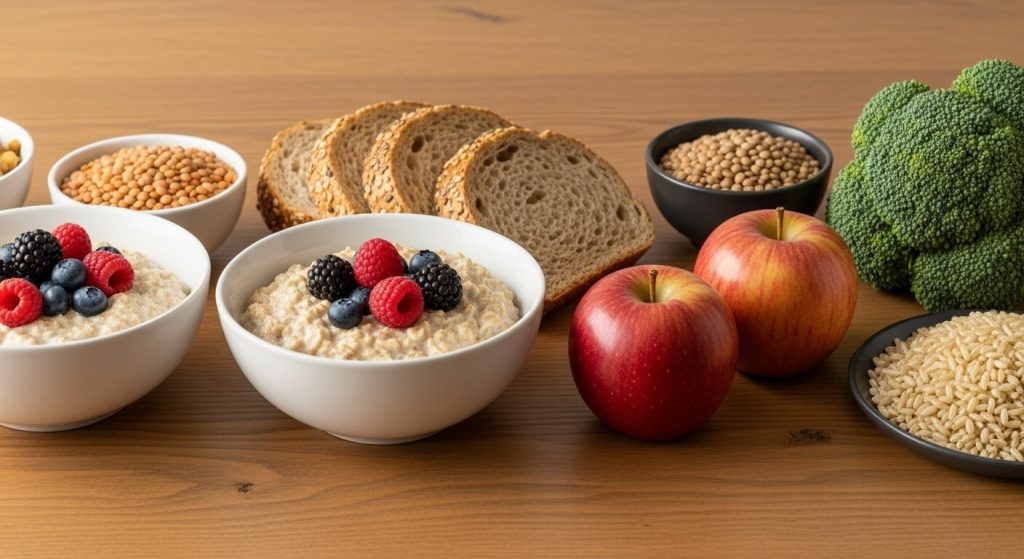
- Breakfast: 60 g rolled oats (~6 g) with 80 g raspberries (~5 g)
- Lunch: a bowl built on 150 g canned chickpeas (~9 g) with carrots and greens (~3 g)
- Snack: 20 g almonds (~2 g)
- Dinner: brussels sprouts or sweet potato (~4 g)
That is roughly 29 g without a supplement and without anything marketed as a superfood. Add it gradually, though: MedlinePlus warns that increasing dietary fiber too quickly can lead to gas, bloating, and cramps, and NIDDK says to drink plenty of water and other liquids if you eat more fiber or take a fiber supplement.
What we are not claiming
- That these are “the top fiber foods” in any absolute sense. They are the highest-fiber items in our database, which covers common foods, not every food that exists.
- Gram thresholds for the “good source of fiber” and “high fiber” label claims. Those figures sit in the Code of Federal Regulations, which we could not retrieve directly, so we do not quote numbers we have not read.
- That fiber from these foods causes weight loss. Federal wording is “can help with weight control.” See what fiber actually does for the exact quotes.
- Anything about fiber and the microbiome, immunity or inflammation. No federal agency page we could reach supports those claims.
FAQ
How much fiber per day? 28 g is the label Daily Value. MedlinePlus gives 21–38 g for adults, NIDDK 22–34 g.
Which food has the most fiber? Per 100 g of dry product, bran and chia seeds. Per realistic portion, beans and berries do more of the work.
Why do dry beans show more fiber than cooked ones? Because cooking adds water. The fiber per 100 g falls; the fiber in your bowl does not.
Do vegetables have enough fiber to matter? Yes, at far fewer calories. Raspberries give 6.5 g per 100 g for 57 calories.
Is fruit fiber different from grain fiber? The mix of soluble and insoluble differs — see soluble vs insoluble fiber for what each type does.
What to do with this
Add up an ordinary day of your own eating using the tables before changing anything. Most people find they are near 16 g and assumed they were near 28. Then add one item from the second table to two meals a day — that alone usually closes half the gap.
Educational content, not medical advice. Values are per 100 g and each one is sourced on its Nutrition Facts card.
This content is for educational purposes only and is not medical advice. Always consult a qualified healthcare professional for personalised guidance.