
Red Onion vs Yellow Onion
Compared on one consistent basis: per 100 g, from USDA data behind each food page.
Onions (Red) vs Onions (Yellow): nutrition per 100 g
| Per 100 g | Onions (Red) | Onions (Yellow) |
|---|---|---|
| Calories | 44 kcal | 38 kcal |
| Protein | 0.9 g | 0.8 g |
| Carbohydrate | 9.9 g | 8.6 g |
| Fat | 0.1 g | 0.1 g |
| Fibre | 2.2 g | 1.9 g |
| Allergens | None listed | None listed |
Vitamins and minerals per 100 g
| Nutrient | Onions (Red) | Onions (Yellow) |
|---|---|---|
| Calcium, Ca | 17 mg | 15 mg |
| Copper, Cu | 0.06 mg | 0.04 mg |
| Iron, Fe | 0.24 mg | 0.28 mg |
| Magnesium, Mg | 11.4 mg | 9 mg |
| Manganese, Mn | 0.12 mg | 0.14 mg |
| Phosphorus, P | 41 mg | 34 mg |
| Potassium, K | 197 mg | 182 mg |
| Selenium, Se | 0.5 ug | 0 ug |
| Sodium, Na | 1 mg | 1 mg |
| Vitamin C, total ascorbic acid | 8.1 mg | 8.2 mg |
| Zinc, Zn | 0.17 mg | 0.2 mg |
Their nutrition profiles sit in a very similar range at the 100 g reference. Either can fit the same role in a meal; let the preparation and preference decide. In this case, compare the listed forms of Onions (Red) and Onions (Yellow) for the recipe you are making.
Full nutrition facts: Onions (Red) · Onions (Yellow)
Bottom line
Per 100 g, Onions (Red) provides 44 kcal, 0.9 g protein and 9.9 g carbohydrate; Onions (Yellow) provides 38 kcal, 0.8 g protein and 8.6 g carbohydrate.
That is a difference of 6 kcal per 100 g — small next to what the cooking method adds.
Yellow onion is the cooking onion: it turns sweet and disappears into a base. Red onion is sharper raw and holds its colour and crunch in salads and sandwiches, but goes a dull grey-purple when cooked for long. Use them where their behaviour fits, not by calories.
In short: yellow onion is the lighter option per 100 g, but with vegetables the choice is usually about texture and how they cook, not calories.
Want a different pair? Use the food comparison tool to compare any two foods from the same category.
Values are per 100 g from the USDA FoodData Central records behind each food page and are rounded; brands and preparation change the numbers. This comparison is educational, not medical advice.
Related comparisons
Recipes using either one
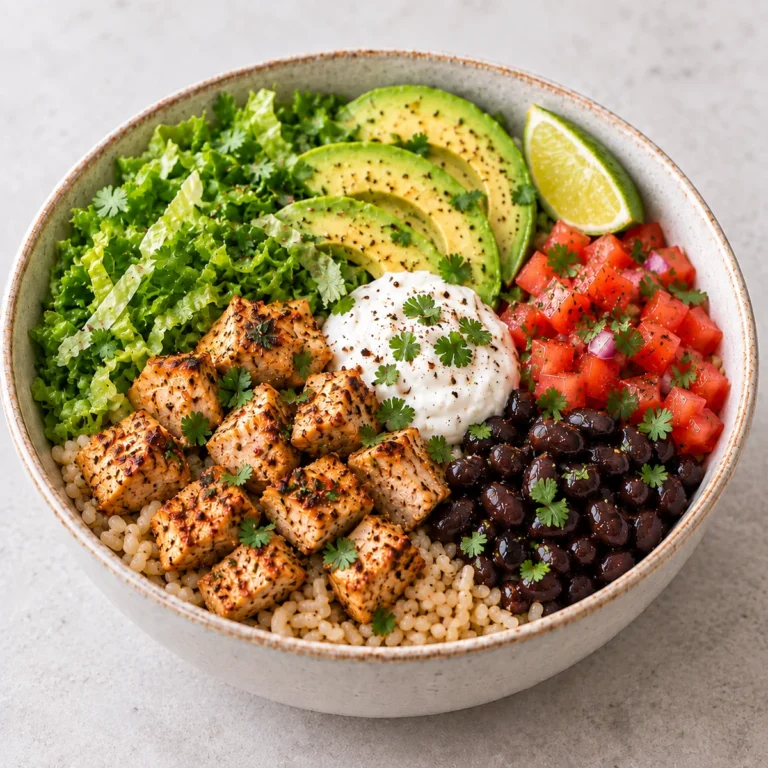 Chicken & Turkey
Chicken Burrito Bowl
612 kcal · P 42.8 g · C 54.3 g · F 25.5 g
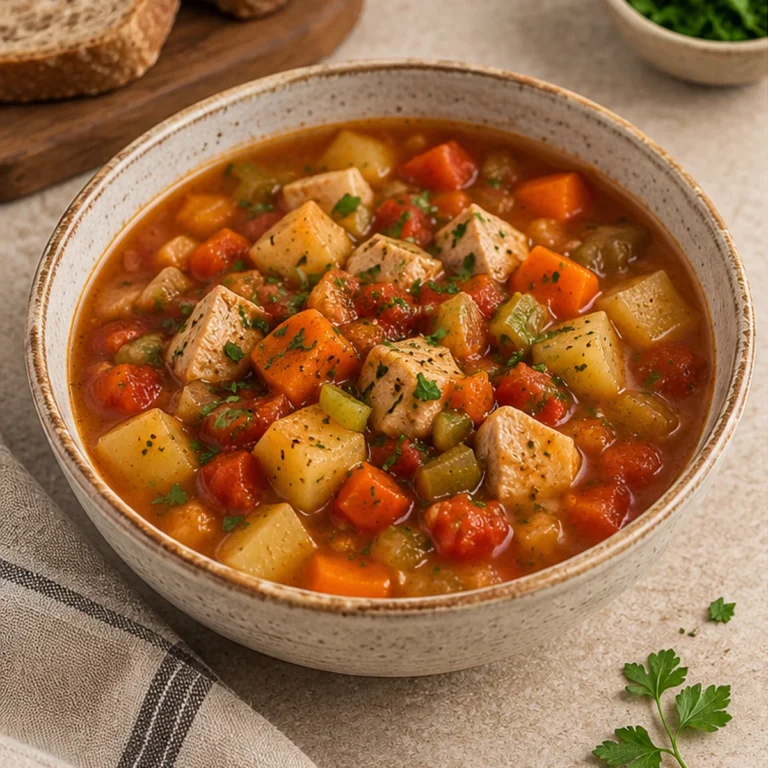 Chicken & Turkey
Turkey Stew
283 kcal · P 26.7 g · C 31.4 g · F 5.3 g
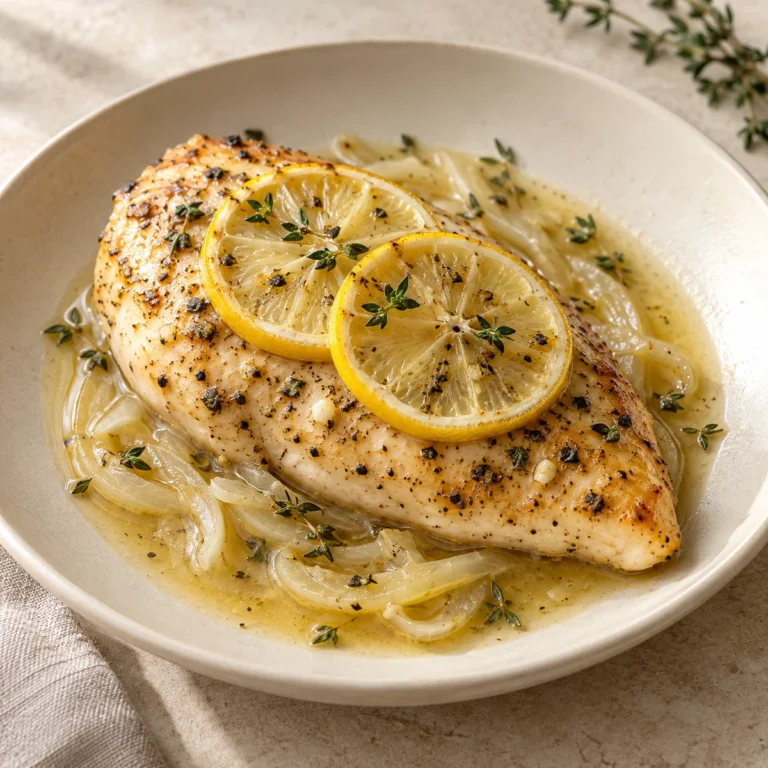 Chicken & Turkey
Baked Lemon Chicken
222 kcal · P 40.4 g · C 7.9 g · F 3.8 g
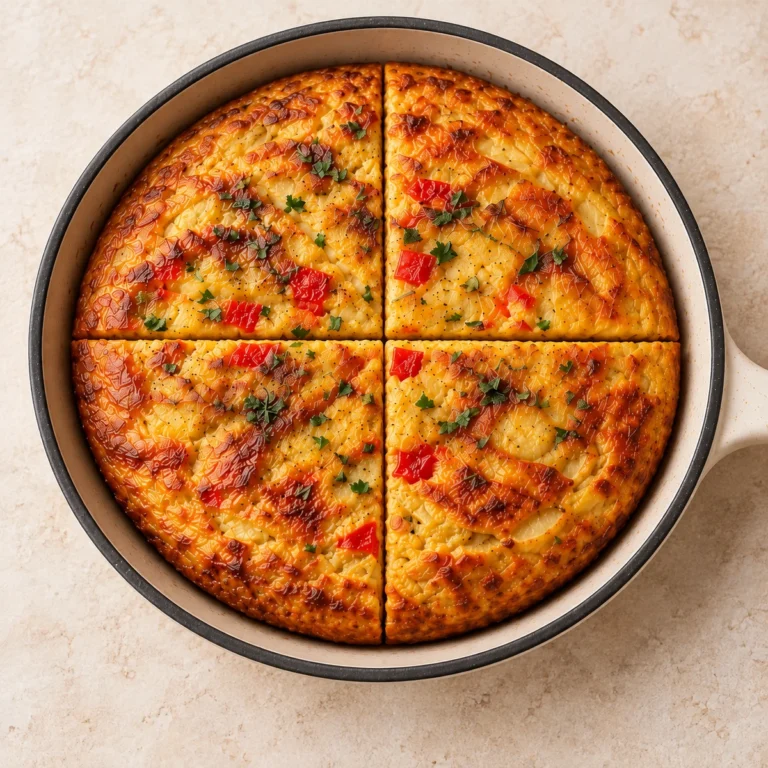 Eggs
EggsSpanish Frittata
215 kcal · P 11.4 g · C 18.4 g · F 10.2 g
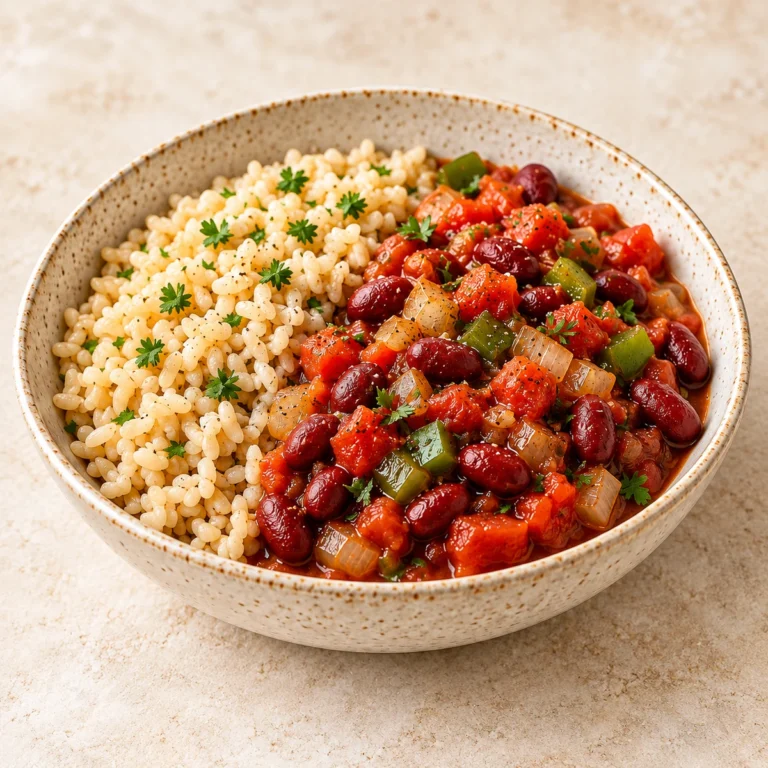 Grains & Pasta
Red Beans and Rice
244 kcal · P 7.2 g · C 49 g · F 2.6 g